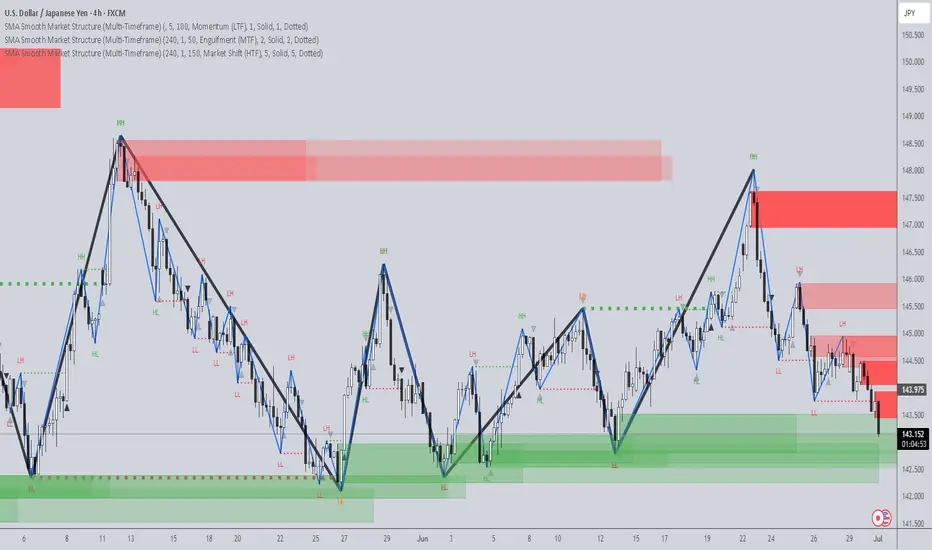
SMA Smooth Market Structure (Multi-Timeframe)SMA Market Structure (Multi-Timeframe) is a powerful tool for tracking structural price action, using simple moving averages across any higher timeframe (HTF). It blends Smart Money Concepts with clean swing logic to reveal trend shifts, breaks of structure, and supply/demand zones.
This indicator highlights key structure features:
• Break of Structure (BOS) – Automatic detection of bullish or bearish swing breaks
• Internal Shifts – Early clues that the market is building toward a reversal
• Liquidity Sweeps (LS) – Detects swing failures that may trap traders
• Zigzag Swing Lines – Cleanly connects swing highs and lows
• Dynamic Zones – Demand (green) and supply (red) blocks drawn from engulfing breakouts
How to Use:
• Set your preferred HTF (e.g. 1H on a 15m chart) to view structure in proper context and
adjust SMA to smooth out market structure for directional consistency
• Watch BOS lines and swing labels like HH, HL, LH, LL for directional clarity
• Use the MS (Market Shift) label to identify full reversals after internal shifts + BOS
• Demand/Supply zones mark areas of previous strength and will update or mitigate automatically
• Alerts notify you of every BOS, MS, HH, LL, and LS event — no need to monitor manually
Customization Features:
• Toggle visibility of market shift markers, internal shifts, and zones
• Choose how internal shifts are calculated (High/Low or Open)
• Customize line style, width, and colors for BOS and zigzag lines
• Control zone duration and how mitigated zones behave (fade or delete)
• Built-in safety for Pine Script’s history limits using smart offset caps
Best Use Tips:
• Combine with price action patterns or volume for confirmation
• MS + BOS + zone tap often marks a high-probability reversal setup
• Use it to align lower timeframe entries with higher timeframe structure
For traders who want structure clarity without clutter, this tool is built to keep your chart actionable and adaptive.
在腳本中搜尋"smart money"
Institutional Volume Footprint ProOVERVIEW
The Institutional Volume Footprint Pro is a comprehensive volume analysis indicator designed to identify institutional trading activity and significant volume patterns. Based on the proven Pocket Pivot Volume methodology by Chris Kacher and Gil Morales, this indicator has been enhanced with multiple additional volume analysis techniques to provide traders with a complete picture of smart money movements.
KEY FEATURES
1. Pocket Pivot Volume (PPV) Detection
- Identifies bullish volume patterns where current volume exceeds the highest down-day volume of the past 10 days
- Blue volume bars with "PPV" labels mark potential institutional accumulation
- Customizable lookback period (5-20 days)
2. Pivot Negative Volume (PNV) Detection
- Spots bearish volume patterns where selling volume exceeds recent up-day volumes
- Orange bars with "PNV" labels indicate potential institutional distribution
- Early warning system for trend reversals
3. Advanced Institutional Patterns
- Accumulation Detection (Aqua): High volume with narrow price range - classic stealth accumulation
- Churning/Distribution (Yellow): Heavy volume with minimal price progress - potential topping pattern
- Volume Dry-up (Purple): Extremely low volume periods that often precede significant moves
- Volume Climax (Fuchsia): Extreme volume spikes signaling potential exhaustion
4. Real-time Analytics Dashboard
- Relative Volume: Current volume compared to 10-day average
- Volume vs MA: Multiple of current volume to selected moving average
- Price Range Analysis: Narrow/Normal/Wide range classification
5. Accumulation/Distribution Trend
- Background coloring shows overall money flow direction
- Green tint: Net accumulation phase
- Red tint: Net distribution phase
HOW TO USE
Entry Signals:
- PPV (Blue): Consider long positions when price breaks above resistance with PPV confirmation
- Accumulation (Aqua): Watch for breakouts following multiple accumulation days
- Volume Dry-up (Purple): Prepare for potential explosive moves
Exit/Warning Signals:
- PNV (Orange): Consider taking profits or tightening stops
- Churning (Yellow): Distribution may be occurring despite stable prices
- Volume Climax (Fuchsia): Potential reversal point - extreme caution advised
CUSTOMIZATION OPTIONS
Analysis Parameters:
- PPV Lookback Period (5-20 days)
- Volume MA Length & Type (SMA/EMA/WMA)
- Relative Volume Threshold
- Climax Volume Multiplier
Visual Controls:
- Toggle Info Table display
- Enable/disable individual label types (PPV, PNV, ACC)
- Show/hide volume moving averages
- Control A/D trend background
- Customize threshold lines
BUILT-IN ALERTS
- Pocket Pivot Volume detected
- Pivot Negative Volume detected
- Institutional Accumulation pattern
- Volume Climax warning
- Volume Dry-up alert
PRO TIPS
1. Combine with Price Action: Volume confirms price - look for PPV at breakouts and PNV at breakdowns
2. Multiple Timeframes: Check daily and weekly charts for confluence
3. Relative Volume Matters: Patterns are stronger when relative volume > 1.5x
4. Watch for Divergences: Price up with decreasing volume = weakness
COLOR LEGEND
- Blue: Pocket Pivot Volume (Bullish)
- Orange: Pivot Negative Volume (Bearish)
- Aqua: Institutional Accumulation
- Yellow: Churning/Distribution
- Purple: Volume Dry-up
- Fuchsia: Volume Climax
- Green: Above-average up volume
- Red: Above-average down volume
- Gray: Below-average volume
EDUCATIONAL BACKGROUND
This indicator implements concepts from:
- "Trade Like an O'Neil Disciple" by Gil Morales & Chris Kacher
- William O'Neil's volume analysis principles
- Richard Wyckoff's accumulation/distribution methodology
Happy Trading! May the volume be with you!

FVG + OB + RSI Divergence + Volume Spikes🧠 FVG + OB + RSI Divergence + Volume Spikes – Market Structure Confluence Tool
This all-in-one indicator brings together four powerful market concepts into a single script designed to help traders identify high-probability trade setups with precision and clarity:
🔍 What It Does
✅ Fair Value Gaps (FVG)
Highlights inefficiencies in price action, showing where the market may return to “rebalance.”
✅ Order Blocks (OB)
Marks key institutional footprints — bullish and bearish order blocks based on engulfing candle structures.
✅ RSI Divergence
Detects both bullish and bearish divergences between price and RSI, signaling potential reversals.
✅ Volume Spikes
Flags bars where volume significantly exceeds the average — a common footprint of smart money.
🎯 How to Use
Use this tool to spot confluences between price inefficiencies (FVG), key reversal zones (OB), momentum shifts (RSI Divergence), and institutional interest (Volume Spikes). The best setups often occur when multiple signals align — especially at key support/resistance or trend zones.
⚙️ Inputs
RSI length (for divergence)
Volume spike sensitivity (multiplier)
Lookback for Order Blocks and FVGs
⚠️ Notes
This is a non-repainting tool.
Ideal for price action, SMC, ICT, and order flow traders.
Combine with your existing strategy and higher time frame bias for best results.

iFVG (BPR)
This indicator detects Fair Value Gaps (FVGs) and Inversion Zones (iFVGs) based concept from the ICT methodology.
An iFVG forms when a bullish and a bearish FVG overlap, creating a double imbalance zone. These are high-reaction points often targeted by smart money.
🔷 What It Detects
Bullish FVG: When the high of Candle 1 is lower than the low of Candle 3
Bearish FVG: When the low of Candle 1 is higher than the high of Candle 3
iFVG (or BPR): When a bullish and bearish FVG overlap, forming a double imbalance zone
🔷Mitigation Logic
An FVG or BPR becomes an iFVG when price closes against its original bias Once this happens, the zone is reclassified as a potential support or resistance (iFVG)
If price later mitigates the iFVG, all visual elements are automatically removed to keep the chart clean
🔷Visual Output
Standard FVGs: Customizable lines between Candle 1 and Candle 3
iFVGs (mitigated BPRs): Adjustable and highlighted rectangles to show the full zone
Mitigation Type: FVG or iFVG zones disappear when 50% of the zone is reached
🔷Custom Settings
Show Last Zones: Set how many recent zones to display on the chart (max 100)
Mitigation Type: Based on the percentage of zone coverage
Color & Style: Customize the appearance of FVG and iFVG zones
🔷 Use Case
This indicator is designed for real-time institutional analysis, helping traders identify:
Recent imbalances (FVGs)
Confluence zones (iFVGs = BPRs)
High-reaction points in the market
Ideal when combined with market structure, liquidity levels, and Kill Zones
Best used in combination with market structure, liquidity zones, and Kill Zone timing .

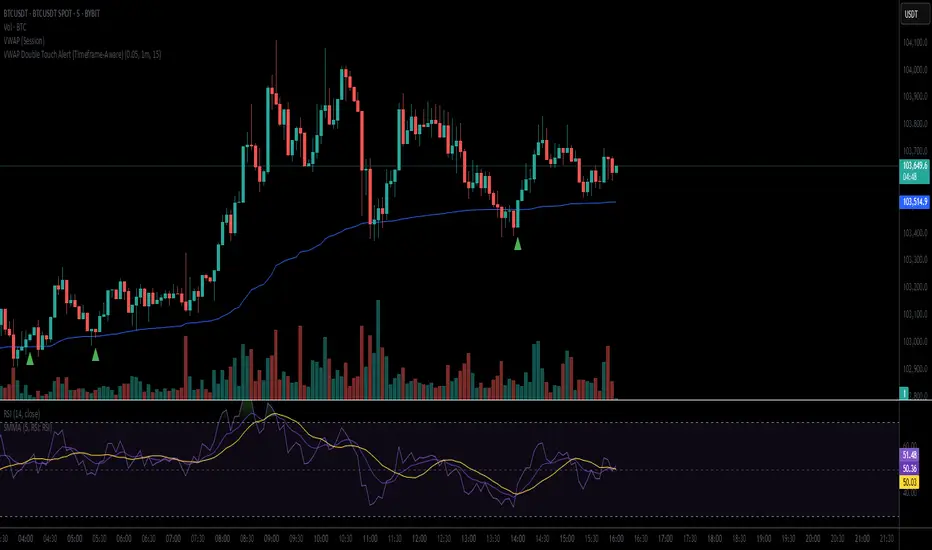
VWAP Double Touch Alert (Timeframe-Aware)📌 VWAP Double Touch Alert — Smart Re-entry Signal for Precision Traders
Take your VWAP trading to the next level with this intelligent indicator that filters out the noise and zeroes in on high-probability re-entry setups.
💡 How it works:
This script tracks every time price touches the VWAP line and alerts you when it happens twice within a defined window of time (adjustable per your timeframe). This is often a sign of smart money accumulation, potential reversals, or explosive breakouts.
🔍 Why Traders Love It:
✅ Filters out weak signals — only alerts on confirmed double touches
✅ Fully adjustable VWAP zone sensitivity
✅ Selectable timeframe profiles or custom window (1m, 5m, 15m, 30m, etc.)
✅ Clean visual cues with minimal chart clutter
✅ Perfect for scalping, intraday reversals, or VWAP mean-reversion strategies
⚙️ Customization:
VWAP zone width (in %)
Time window in bars or automatic based on timeframe
Custom alert messages
Alert only triggers once per double-touch event to avoid spamming
🎯 Best For:
Crypto scalpers & day traders
VWAP bounce and mean-reversion traders
Traders who want clean, conclusive entry alerts without lag
Apex Edge - Session Sweep ProApex Edge Session Sweep Pro
By Apex Edge | 2025 Edition
🔍 What is it?
The Apex Session Sweep Pro is a precision trading tool designed for identifying high-probability liquidity sweep entries during key global market sessions. It combines powerful sweep detection logic with dynamic candle colouring, session visualization, TP projections, and real-time alerts — all within a clean, performance-optimized Pine Script engine.
This is not your average session box indicator. This is Apex-grade.
⚙️ How it Works
The indicator detects session liquidity sweeps by tracking price action relative to previous session highs and lows. When a session high/low is swept (i.e., price breaches it and then closes in the opposite direction), it generates a signal:
Buy Signal → Price sweeps previous low and closes back above it
Sell Signal → Price sweeps previous high and closes back below it
Each session is boxed on the chart (Tokyo, London, New York, Sydney), color-coded, and dynamically labelled.
Upon detecting a valid sweep, the script:
Plots a small entry label (toggleable)
Projects up to 5 customizable TP levels
Coloured candles for visual trade direction
Alerts for Buy or Sell sweep signals (optional)
All elements are memory-managed and customizable to suit your trading style.
🧠 Key Features
✅ Smart Sweep Detection Logic
✅ Global Market Session Boxes (Custom Times)
✅ Toggleable Entry Labels + TP Levels
✅ Candle Colouring by Signal
✅ Manual TP input + TP toggles
✅ Real-time Alerts for Apex entries
🕒 Why Are My Sessions Offset?
Your chart’s time zone may be different from UTC. This script is UTC-based by design, so if your chart is set to UTC+1, for example, the sessions will appear one hour later. Either:
Adjust your chart to UTC or or Exchange for perfect alignment,
Or tweak the session input times manually.
🧰 Who is this for?
This tool is made for:
Intraday traders looking for sweeps into liquidity
SMC (Smart Money Concept) strategists
Forex, crypto, and indices traders
Anyone who uses session-based levels to define entries
Whether you scalp London or ride NY swings, this tool frames each session cleanly — and shows you where the traps are laid.
🚨 Disclaimer
This indicator is a technical tool, not financial advice. Use proper risk management. Past performance ≠ future results.

Institutional Support/Resistance Locator🏛️ Institutional Support/Resistance Locator
Overview
The Institutional Support/Resistance Locator identifies high-probability demand and supply zones based on strong price rejection, large candle bodies, and elevated volume . These zones are commonly targeted or defended by institutional participants, helping traders anticipate potential reversal or continuation areas.
⸻
How It Works
The indicator uses a confluence of conditions to detect zones:
• Large Body Candles: Body size must exceed the moving average body size multiplied by a user-defined factor.
• High Volume: Volume must exceed the moving average volume by a configurable multiplier.
• Wick Rejection: Candles must show strong upper or lower wicks indicating aggressive rejection.
• If all criteria are met:
• Bullish candles form a Demand Zone.
• Bearish candles form a Supply Zone.
Each zone is plotted for a customizable number of future bars, representing areas where institutions may re-engage with the market.
⸻
Key Features
• ✅ Highlights institutional demand and supply areas dynamically
• ✅ Customizable sensitivity: body, volume, wick, padding, and zone extension
• ✅ Zones plotted as translucent regions with auto-expiry
• ✅ Works across all timeframes and markets
⸻
How to Use
• Trend Traders: Use demand zones for potential bounce entries in uptrends, and supply zones for pullback short entries in downtrends.
• Range Traders: Use zones as potential reversal points inside sideways market structures.
• Scalpers & Intraday Traders: Combine with volume or price action near zones for refined entries.
Always validate zone reactions with supporting indicators or price behavior.
⸻
Why This Combination?
The combination of wick rejection, volume confirmation, and large candle structure is designed to reflect footprints of smart money. Rather than relying on fixed pivots or subjective zones, this logic adapts to the current market context with statistically grounded conditions.
⸻
Why It’s Worth Using
This tool offers traders a structured way to interpret institutional activity on charts without relying on guesswork. By plotting potential high-impact areas, it helps improve reaction time.
⸻
Note :
• This script is open-source and non-commercial.
• No performance guarantees or unrealistic claims are made.
• It is intended for educational and analytical purposes only.

ICT Turtle Soup (Liquidity Reversal)ICT Turtle Soup — Liquidity Reversal Detection
Trap the Trap: A Precision Reversal Strategy from the Inner Circle Trader Playbook
This indicator implements the Turtle Soup liquidity reversal setup — a widely used ICT (Inner Circle Trader) concept that targets false breakouts beyond recent swing highs or lows. These patterns typically occur when price grabs liquidity above or below a known level, then snaps back, trapping retail traders and creating a high-probability reversal scenario.
🔍 What This Script Does:
Detects Liquidity Sweeps Above/Below Key Swing Levels
Uses a customizable swing lookback to identify recent swing highs and lows.
Triggers a Bearish Turtle Soup when price runs above a previous swing high and closes back below.
Triggers a Bullish Turtle Soup when price sweeps below a prior swing low and closes back above.
Plots Clear Visual Signals
Reversal signals appear as 🐢🔻 (Bearish) or 🐢🔺 (Bullish) markers directly on your chart.
Optional labels can be enabled for enhanced journaling and review.
Real-Time Alerts
Receive alert notifications when a Turtle Soup setup is detected — ideal for scalpers or intraday traders watching for reversals around liquidity pools.
⚙️ Customization Options:
Set the swing lookback sensitivity (default: 5)
Enable or disable labels
Choose label font size
Customize colors for bullish and bearish signals
💡 How to Use:
Deploy on intraday timeframes (e.g. 5m–15m) for high-resolution liquidity analysis.
Watch for signals at key highs/lows, session extremes, or zones where liquidity is likely resting.
Combine with tools like FVGs, Order Blocks, and OTE zones for layered confirmation.
🔗 Combine With These Tools for a Complete SMC Edge:
✅ First FVG — Opening Range Fair Value Gap Detector
✅ ICT SMC Liquidity Grabs + OB + Fibonacci OTE Levels
✅ Liquidity Levels — Smart Swing Lows
Together, these tools form a high-precision Smart Money toolkit — helping traders map, anticipate, and act on institutional-level liquidity events with clarity and confidence.

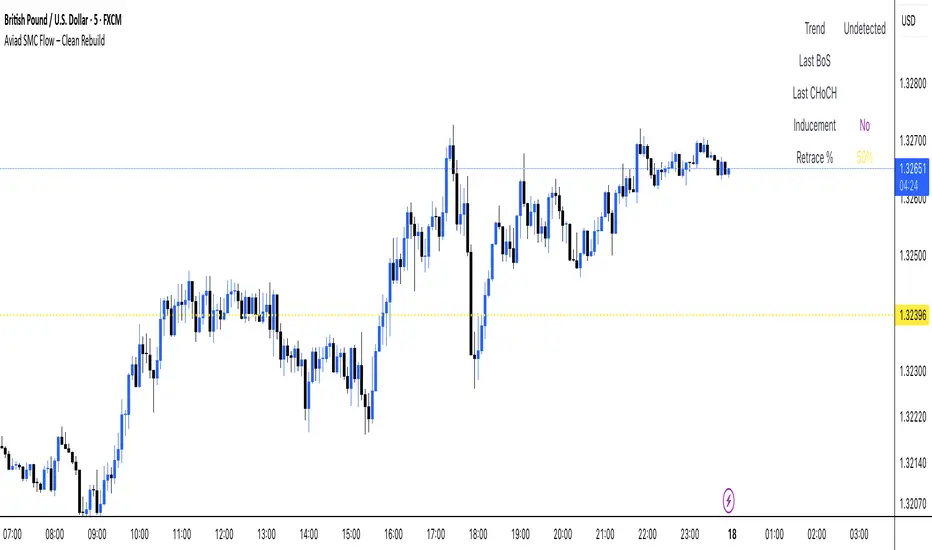
Aviad SMC Flow🔹 Aviad SMC Flow – Smart Structure & Zones Indicator
A professional SMC-based indicator for identifying:
✅ BoS – Break of Structure
✅ CHoCH – Change of Character
✅ MSS – Market Structure Shift
✅ Automated Support & Resistance Zones
✅ Liquidity Grab and Reversal Points
✅ Market Structure with historical display
Optimized for 1H and lower timeframes.
Designed for real Smart Money Concepts (SMC) trading.
Perfect for intraday traders, swing traders, and scalpers.
PRIME 2.0PRIME 2.0 — Precision Entry Tool
PRIME 2.0 is a smart price action-based indicator designed for intraday traders who want to catch high-probability moves during the London session. It uses a combination of market structure shifts (CHOCH – Change of Character) and session-based timing to identify potential entries.
🔍 Key Features:
Session-Based Logic: Activates after the London market opens, filtering noise from other sessions.
CHOCH Detection: Spots shifts in market structure by identifying crossover and crossunder of candle highs/lows.
Visual Entry Points: Plots real-time entry points based on structure change.
🧠 Who Is It For?
Scalpers and day traders
Traders who follow Smart Money Concepts (SMC)
Anyone looking to improve entry precision without clutter
⚠️ Disclaimer:
This indicator does not generate buy/sell signals or exit points. It is meant to be used as a tool within a broader trading strategy. Combine it with your own risk management and market knowledge for best results

CandelaCharts - Premium & Discount 📝 Overview
Premium and Discount are key concepts in ICT (Inner Circle Trader) trading strategies, used to pinpoint ideal entry and exit points in the market. These concepts are based on an understanding of market structure and the behavior of institutional traders, commonly referred to as Smart Money.
To understand the Premium and Discount zones, it's crucial to first grasp the concept of the equilibrium level, also known as the basic or fair value. The equilibrium represents the midpoint of a given price range and acts as a reference point, dividing the range into Premium and Discount zones.
The equilibrium reflects the "fair value" of the price within the considered range. Traders use this as a benchmark to assess whether the current price is in the Premium or Discount zone.
The Premium zone lies above the equilibrium level, while the Discount zone is located below it within the price range.
📦 Features
Swing-based detection
Custom detection
Modes
Styling
⚙️ Settings
Range: Determines how you will identify Premium and Discount, either by swing points or by custom date.
Mode: Controls what UI will be displayed
Premium: Sets the Premium color
Discount: Sets the Discount color
Equilibrium: Sets the Equilibrium color
Labels: Controls the labels visibility
⚡️ Showcase
Pro Mode
Solid Mode
Outlined Mode
Flat Mode
The Indicator can be effortlessly applied in replay mode to highlight premium and discount zones based on the most prominent market swings.
🚨 Alerts
The indicator does not provide any alerts!
⚠️ Disclaimer
Trading involves significant risk, and many participants may incur losses. The content on this site is not intended as financial advice and should not be interpreted as such. Decisions to buy, sell, hold, or trade securities, commodities, or other financial instruments carry inherent risks and are best made with guidance from qualified financial professionals. Past performance is not indicative of future results.

Pipstocrat Market Participant AnalysisPipstocrat Market Participant Analysis (PMPA) , analyzes the behavior of different types of traders in the market: Hot Money (short-term traders), Smart Money (institutional or professional traders), and Retail Traders . It uses RSI-based calculations to measure their activity and displays the results as colored bars on a chart.
Customizable Colors: Users can change the colors for each type of trader and other visual elements like reference lines.
Reference Lines: Horizontal lines at levels 5 (Support), 10 (Neutral), and 15 (Resistance) help interpret the data.
Focus on RSI: The script simplifies analysis by focusing solely on RSI-based signals.
This tool helps traders quickly identify trends and sentiment in the market, making it easier to spot potential opportunities.

Sniper Trade Pro (ES 15-Min) - Topstep Optimized🔹 Overview
Sniper Trade Pro is an advanced algorithmic trading strategy designed specifically for E-mini S&P 500 (ES) Futures on the 15-minute timeframe. This strategy is optimized for Topstep 50K evaluations, incorporating strict risk management to comply with their max $1,000 daily loss limit while maintaining a high probability of success.
It uses a multi-confirmation approach, integrating:
✅ Money Flow Divergence (MFD) → To track liquidity imbalances and institutional accumulation/distribution.
✅ Trend Confirmation (EMA + VWAP) → To identify strong trend direction and avoid choppy markets.
✅ ADX Strength Filter → To ensure entries only occur in trending conditions, avoiding weak setups.
✅ Break-Even & Dynamic Stop-Losses → To reduce drawdowns and protect profits dynamically.
This script automatically generates Buy and Sell signals and provides built-in risk management for automated trading execution through TradingView Webhooks.
🔹 How Does This Strategy Work?
📌 1. Trend Confirmation (EMA + VWAP)
The strategy uses:
✔ 9-EMA & 21-EMA: Fast-moving averages to detect short-term momentum.
✔ VWAP (Volume-Weighted Average Price): Ensures trades align with institutional volume flow.
How it works:
Bullish Condition: 9-EMA above 21-EMA AND price above VWAP → Confirms buy trend.
Bearish Condition: 9-EMA below 21-EMA AND price below VWAP → Confirms sell trend.
📌 2. Liquidity & Money Flow Divergence (MFD)
This indicator measures liquidity shifts by tracking momentum changes in price and volume.
✔ MFD Calculation:
Uses Exponential Moving Average (EMA) of Momentum (MOM) to detect changes in buying/selling pressure.
If MFD is above its moving average, it signals liquidity inflows → bullish strength.
If MFD is below its moving average, it signals liquidity outflows → bearish weakness.
Why is this important?
Detects when Smart Money is accumulating or distributing before major moves.
Filters out false breakouts by confirming momentum strength before entry.
📌 3. Trade Entry Triggers (Candlestick Patterns & ADX Filter)
To avoid random entries, the strategy waits for specific candlestick confirmations with ADX trend strength:
✔ Bullish Entry (Buy Signal) → Requires:
Bullish Engulfing Candle (Reversal confirmation)
ADX > 20 (Ensures strong trending conditions)
MFD above its moving average (Liquidity inflows)
9-EMA > 21-EMA & price above VWAP (Trend confirmation)
✔ Bearish Entry (Sell Signal) → Requires:
Bearish Engulfing Candle (Reversal confirmation)
ADX > 20 (Ensures strong trending conditions)
MFD below its moving average (Liquidity outflows)
9-EMA < 21-EMA & price below VWAP (Trend confirmation)
📌 4. Risk Management & Profit Protection
This strategy is built with strict risk management to maintain low drawdowns and maximize profits:
✔ Dynamic Position Sizing → Automatically adjusts trade size to risk a fixed $400 per trade.
✔ Adaptive Stop-Losses → Uses ATR-based stop-loss (0.8x ATR) to adapt to market volatility.
✔ Take-Profit Targets → Fixed at 2x ATR for a Risk:Reward ratio of 2:1.
✔ Break-Even Protection → Moves stop-loss to entry once price moves 1x ATR in profit, locking in gains.
✔ Max Daily Loss Limit (-$1,000) → Stops trading if total losses exceed $1,000, complying with Topstep rules.

ICT Judas Swing | Flux Charts💎 GENERAL OVERVIEW
Introducing our new ICT Judas Swing Indicator! This indicator is built around the ICT's "Judas Swing" strategy. The strategy looks for a liquidity grab around NY 9:30 session and a Fair Value Gap for entry confirmation. For more information about the process, check the "HOW DOES IT WORK" section.
Features of the new ICT Judas Swing :
Implementation of ICT's Judas Swing Strategy
2 Different TP / SL Methods
Customizable Execution Settings
Customizable Backtesting Dashboard
Alerts for Buy, Sell, TP & SL Signals
📌 HOW DOES IT WORK ?
The strategy begins by identifying the New York session from 9:30 to 9:45 and marking recent liquidity zones. These liquidity zones are determined by locating high and low pivot points: buyside liquidity zones are identified using high pivots that haven't been invalidated, while sellside liquidity zones are found using low pivots. A break of either buyside or sellside liquidity must occur during the 9:30-9:45 session, which is interpreted as a liquidity grab by smart money. The strategy assumes that after this liquidity grab, the price will reverse and move in the opposite direction. For entry confirmation, a fair value gap (FVG) in the opposite direction of the liquidity grab is required. A buyside liquidity grab calls for a bearish FVG, while a sellside grab requires a bullish FVG. Based on the type of FVG—bullish for buys and bearish for sells—the indicator will then generate a Buy or Sell signal.
After the Buy or Sell signal, the indicator immediately draws the take-profit (TP) and stop-loss (SL) targets. The indicator has three different TP & SL modes, explained in the "Settings" section of this write-up.
You can set up alerts for entry and TP & SL signals, and also check the current performance of the indicator and adjust the settings accordingly to the current ticker using the backtesting dashboard.
🚩 UNIQUENESS
This indicator is an all-in-one suit for the ICT's Judas Swing concept. It's capable of plotting the strategy, giving signals, a backtesting dashboard and alerts feature. Different and customizable algorithm modes will help the trader fine-tune the indicator for the asset they are currently trading. Three different TP / SL modes are available to suit your needs. The backtesting dashboard allows you to see how your settings perform in the current ticker. You can also set up alerts to get informed when the strategy is executable for different tickers.
⚙️ SETTINGS
1. General Configuration
Swing Length -> The swing length for pivot detection. Higher settings will result in
FVG Detection Sensitivity -> You may select between Low, Normal, High or Extreme FVG detection sensitivity. This will essentially determine the size of the spotted FVGs, with lower sensitivies resulting in spotting bigger FVGs, and higher sensitivies resulting in spotting all sizes of FVGs.
2. TP / SL
TP / SL Method ->
a) Dynamic: The TP / SL zones will be auto-determined by the algorithm based on the Average True Range (ATR) of the current ticker.
b) Fixed : You can adjust the exact TP / SL ratios from the settings below.
Dynamic Risk -> The risk you're willing to take if "Dynamic" TP / SL Method is selected. Higher risk usually means a better winrate at the cost of losing more if the strategy fails. This setting is has a crucial effect on the performance of the indicator, as different tickers may have different volatility so the indicator may have increased performance when this setting is correctly adjusted.

Mxwll Price Action Suite [Mxwll]Introducing the Mxwll Price Action Suite!
The Mxwll Price Action Suite is an all-in-one analysis indicator incorporating elements of SMC and also ideas extending beyond the trading methodology!
Features
Internal structures
External structures
Customizable Sensitivities
BoS/CHoCH
Order Blocks
HH/LH/LL/LH Areas
Rolling TF highs/lows
Rolling Volume Comparisons
Auto Fibs
And more!
The image above shows the indicator's market structure identification capabilities. Internal BoS and CHoCH structures in addition to overarching market structures are available with customizable sensitivities.
The image above shows the indicator identifying order blocks! Additionally, HH/LH/LL/LH areas are also identified.
The image above shows a rolling area of interest. These areas can be compared to supply/demand zones, where traders might consider a bargain long/short/sell area.
The indicator displays a rolling 4hr high/low and 1D high/low, alongside auto fibonacci levels with a customizable sensitivity.
Finally, the Mxwll Price Action Suite shows relevant session information.
Table information
Current Session
Countdown to session close
Next Session
Countdown to next session open
Rolling 4-Hr volume intensity
Rolling 24-Hr volume intensity
Introducing the Mxwll SMC Suite!
The Mxwll SMC Suite is an all-in-one analysis indicator incorporating elements of SMC and also ideas extending beyond the trading methodology!
Features
Internal structures
External structures
Customizable Sensitivities
BoS/CHoCH
Order Blocks
HH/LH/LL/LH Areas
Rolling TF highs/lows
Rolling Volume Comparisons
Auto Fibs
And more!
The image above shows the indicator's market structure identification capabilities. Internal BoS and CHoCH structures in addition to overarching market structures are available with customizable sensitivities.
The image above shows the indicator identifying order blocks! Additionally, HH/LH/LL/LH areas are also identified.
The image above shows a rolling area of interest. These areas can be compared to supply/demand zones, where traders might consider a bargain long/short/sell area.
The indicator displays a rolling 4hr high/low and 1D high/low, alongside auto fibonacci levels with a customizable sensitivity.
Finally, the Mxwll Price Action Suite shows relevant session information.
Table information
Current Session
Countdown to session close
Next Session
Countdown to next session open
Rolling 4-Hr volume intensity
Rolling 24-Hr volume intensity
Expanded Features of Mxwll Price Action Suite
Internal and External Structures
Internal Structures: These elements refer to the price formations and patterns that occur within a smaller scope or a specific trading session. The suite can detect intricate details like minor support/resistance levels or short-term trend reversals.
External Structures: These involve larger, more significant market patterns and trends spanning multiple sessions or time frames. This capability helps traders understand overarching market directions.
Customizable Sensitivities
Adjusting sensitivity settings allows users to tailor the indicator's responsiveness to market changes. Higher sensitivity can catch smaller fluctuations, while lower sensitivity might focus on more significant, reliable market moves.
Break of Structure (BoS) and Change of Character (CHoCH)
BoS: This feature identifies points where the price breaks a significant structure, potentially indicating a new trend or a trend reversal.
CHoCH: Detects subtle shifts in the market's behavior, which could suggest the early stages of a trend change before they become apparent to the broader market.
Order Blocks and Market Phases
Order Blocks: These are essentially price levels or zones where significant trading activities previously occurred, likely pointing to the positions of smart money.
HH/LH/LL/LH Areas: Identifying Higher Highs (HH), Lower Highs (LH), Lower Lows (LL), and Lower Highs (LH) helps in understanding the trend and market structure, aiding in predictive analysis.
Rolling Timeframe Highs/Lows and Volume Comparisons
Tracks highs and lows over specified rolling periods, providing dynamic support and resistance levels.
Compares volume data across different timeframes to assess the strength or weakness of the current price movements.
Auto Fibonacci Levels
Automatically calculates and plots Fibonacci retracement levels, a popular tool among traders to identify potential reversal points based on past movements.
Session Data and Volume Intensity
Session Information: Displays current and upcoming trading sessions along with countdown timers, which is crucial for day traders and those trading on session overlaps.
Volume Intensity: Measures and compares the volume within the last 4 hours and 24 hours to gauge market activity and potential breakout/breakdown movements.
Visualizations and Practical Use
Dynamic Visuals: The suite provides dynamic visual aids, such as real-time updating of high/low markers and Fibonacci levels, which adjust as new data comes in. This feature is critical in fast-paced markets.
Strategic Entry/Exit Points: By identifying order blocks and using Fibonacci levels, traders can pinpoint strategic entry and exit points, maximizing potential returns.
Risk Management: Enhanced features like session countdowns and volume intensity help in better risk management by providing traders with more data on market sentiment and potential volatility.

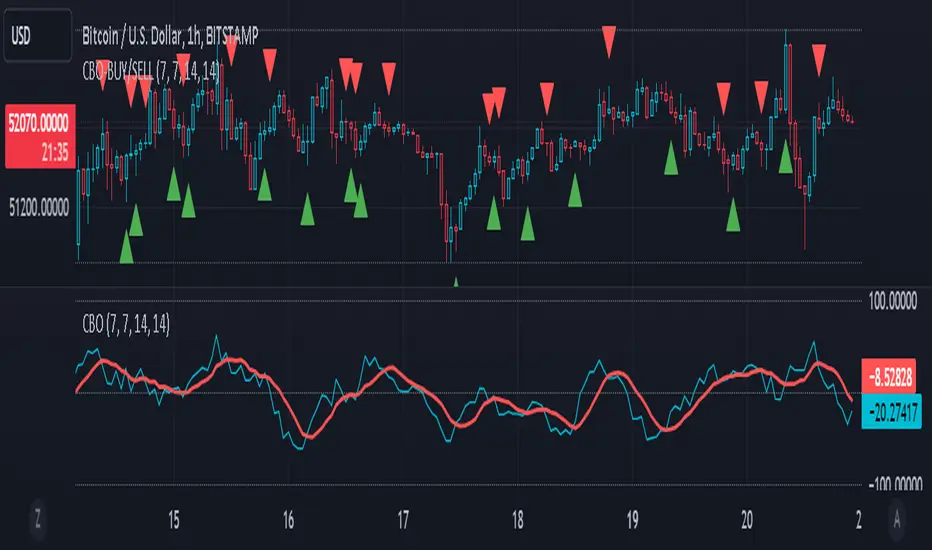
CBO (Candle Bias Oscillator)The Candle Bias Oscillator (CBO) with volume and ATR scaling is a unique technical analysis tool designed to capture market sentiment through the analysis of candlestick patterns, volume momentum, and market volatility. This indicator is built on the foundation of assessing the bias within a candlestick's body and wicks, adjusted for market volatility using the Average True Range (ATR), and further refined by comparing the Rate of Change (ROC) in volume and the adjusted bias. The culmination of these calculations results in the CBO, a smoothed oscillator that highlights potential market turning points through divergence analysis.
Key Features:
Bias Calculations: Utilizes the relationship between the candle's body and wicks to determine the market's immediate bias, offering a nuanced view beyond simple price action. Have you ever wanted to quantify exactly how bullish or bearish a particular candle or candlestick pattern is? Whether it's dojis, hammers, engulfing, gravestones, evening morning star, three soldiers etc. you don't have to memorize 50 candlestick patterns anymore.
Volatility Adjustment: Employs the ATR to adjust the bias calculation, ensuring the oscillator remains relevant across varying market conditions by accounting for volatility.
Momentum and Divergence: Measures the momentum in volume and bias through ROC calculations, identifying divergence that may signal reversals or significant price movements.
Signal Line: A smoothed version of the CBO, derived from its own values, serving as a benchmark for identifying potential crossovers and divergences.
Utility and Application:
The CBO with Divergence Scaling is developed for traders who seek a deeper understanding of market dynamics beyond price movements alone. It is particularly useful for identifying potential reversals or continuation patterns early, by highlighting divergence between market sentiment (as expressed through candlestick bias) and actual volume movements. In this way, it aligns us retail traders with institutional traders and smart money. This indicator is versatile and can be applied across various time frames and market instruments, offering value to both short-term traders and long-term investors.
How to Use:
Trend Identification: The direction and value of the CBO provide insights into the prevailing market trend. A positive oscillator value may indicate bullish sentiment, while a negative value suggests bearish sentiment.
Signal Line Crossovers: Crossovers between the CBO and its signal line can be used as potential buy or sell signals. A crossover above the signal line might indicate a buying opportunity, whereas a crossover below could suggest a selling point.
Divergence: Discrepancies between the CBO and price action (especially when confirmed by volume ROC) can highlight potential reversals.
Customization and Parameters: This script allows users to adjust several parameters, including oscillator periods, signal line periods, ATR periods, and ROC periods for divergence, to best fit their trading strategy and the characteristics of the market they are analyzing.
Conclusion:
The Custom Bias Oscillator with Divergence Scaling is a comprehensive tool designed to offer traders a multi-faceted view of market conditions, combining elements of price action, volatility, and momentum. By integrating these aspects into a single indicator, it aims to provide a more rounded and actionable insight into market trends and potential turning points.
To comply with best practices and ensure clarity regarding the informational nature of the Custom Bias Oscillator (CBO) tool, it's crucial to include a disclaimer about the non-advisory nature of the script. Here's a suitable disclaimer that you can add to the end of your script description or publication:
Disclaimer:
The Custom Bias Oscillator (CBO) with Divergence Scaling and its accompanying analysis are provided as tools for educational and informational purposes only and should not be construed as financial advice. The creator of this indicator does not guarantee any specific outcomes or profit, and all users should be aware of the risks involved in trading and investing. Users should conduct their own research and consult with a professional financial advisor before making any investment decisions. The use of this indicator is at the user's own risk, and the creator bears no responsibility for any direct or consequential loss arising from any use of this tool or the information provided herein.
SMC sessionzz by JelleThe main function of this indicator is to make it easy to identify several smart money concepts (SMC) and ICT practices by using a single indicator. The functions themselves are not my original content, but rather a collection of several scripts with some tweaking, combined into a single indicator.
Main functions:
- Provides the ability to set bar color for London, New York and Asia sessions
- Provides the ability to set background color for London, New York and Asia sessions
- Provides the ability to indicate NY and GMT midnight on the chart by plotting vertical lines
- Provides several smart features to turn bar color and background color on/off depending on the timeframe
Usage example:
- Easily determine each session high and low by using the bar color feature
- Easily determine the daily high and low by using the vertical midnight lines
- Easily determine ICT kill zones by setting background color for each session
- Easily avoid clutter on your chart by using the timeframe filters
PivotBoss TriggersI have collected the four PivotBoss indicators into one big indicator. Eventually I will delete the individual ones, since you can just turn off the ones you don't need in the style controller. Cheers.
Wick Reversal
When the market has been trending lower then suddenly forms a reversal wick candlestick , the likelihood of
a reversal increases since buyers have finally begun to overwhelm the sellers. Selling pressure rules the decline,
but responsive buyers entered the market due to perceived undervaluation. For the reversal wick to open near the
high of the candle, sell off sharply intra-bar, and then rally back toward the open of the candle is bullish , as it
signifies that the bears no longer have control since they were not able to extend the decline of the candle, or the
trend. Instead, the bulls were able to rally price from the lows of the candle and close the bar near the top of its
range, which is bullish - at least for one bar, which hadn't been the case during the bearish trend.
Essentially, when a reversal wick forms at the extreme of a trend, the market is telling you that the trend
either has stalled or is on the verge of a reversal. Remember, the market auctions higher in search of sellers, and
lower in search of buyers. When the market over-extends itself in search of market participants, it will find itself
out of value, which means responsive market participants will look to enter the market to push price back toward
an area of perceived value. This will help price find a value area for two-sided trade to take place. When the
market finds itself too far out of value, responsive market participants will sometimes enter the market with
force, which aggressively pushes price in the opposite direction, essentially forming reversal wick candlesticks .
This pattern is perhaps the most telling and common reversal setup, but requires steadfast confirmation in order
to capitalize on its power. Understanding the psychology behind these formations and learning to identify them
quickly will allow you to enter positions well ahead of the crowd, especially if you've spotted these patterns at
potentially overvalued or undervalued areas.
Fade (Extreme) Reversal
The extreme reversal setup is a clever pattern that capitalizes on the ongoing psychological patterns of
investors, traders, and institutions. Basically, the setup looks for an extreme pattern of selling pressure and then
looks to fade this behavior to capture a bullish move higher (reverse for shorts). In essence, this setup is visually
pointing out oversold and overbought scenarios that forces responsive buyers and sellers to come out of the dark
and put their money to work-price has been over-extended and must be pushed back toward a fair area of value
so two-sided trade can take place.
This setup works because many normal investors, or casual traders, head for the exits once their trade
begins to move sharply against them. When this happens, price becomes extremely overbought or oversold,
creating value for responsive buyers and sellers. Therefore, savvy professionals will see that price is above or
below value and will seize the opportunity. When the scared money is selling, the smart money begins to buy, and
Vice versa.
Look at it this way, when the market sells off sharply in one giant candlestick , traders that were short
during the drop begin to cover their profitable positions by buying. Likewise, the traders that were on the
sidelines during the sell-off now see value in lower prices and begin to buy, thus doubling up on the buying
pressure. This helps to spark a sharp v-bottom reversal that pushes price in the opposite direction back toward
fair value.
Engulfing (Outside) Reversal
The power behind this pattern lies in the psychology behind the traders involved in this setup. If you have
ever participated in a breakout at support or resistance only to have the market reverse sharply against you, then
you are familiar with the market dynamics of this setup. What exactly is going on at these levels? To understand
this concept is to understand the outside reversal pattern. Basically, market participants are testing the waters
above resistance or below support to make sure there is no new business to be done at these levels. When no
initiative buyers or sellers participate in range extension, responsive participants have all the information they
need to reverse price back toward a new area of perceived value.
As you look at a bullish outside reversal pattern, you will notice that the current bar's low is lower than the
prior bar's low. Essentially, the market is testing the waters below recently established lows to see if a downside
follow-through will occur. When no additional selling pressure enters the market, the result is a flood of buying
pressure that causes a springboard effect, thereby shooting price above the prior bar's highs and creating the
beginning of a bullish advance.
If you recall the child on the trampoline for a moment, you'll realize that the child had to force the bounce
mat down before he could spring into the air. Also, remember Jennifer the cake baker? She initially pushed price
to $20 per cake, which sent a flood of orders into her shop. The flood of buying pressure eventually sent the price
of her cakes to $35 apiece. Basically, price had to test the $20 level before it could rise to $35.
Let's analyze the outside reversal setup in a different light for a moment. One of the reasons I like this setup
is because the two-bar pattern reduces into the wick reversal setup, which we covered earlier in the chapter. If
you are not familiar with candlestick reduction, the idea is simple. You are taking the price data over two or more
candlesticks and combining them to create a single candlestick . Therefore, you will be taking the open, high, low,
and close prices of the bars in question to create a single composite candlestick .
Doji Reversal
The doji candlestick is the epitome of indecision. The pattern illustrates a virtual stalemate between buyers
and sellers, which means the existing trend may be on the verge of a reversal. If buyers have been controlling a
bullish advance over a period of time, you will typically see full-bodied candlesticks that personify the bullish
nature of the move. However, if a doji candlestick suddenly appears, the indication is that buyers are suddenly
not as confident in upside price potential as they once were. This is clearly a point of indecision, as buyers are no
longer pushing price to higher valuation, and have allowed sellers to battle them to a draw-at least for this one
candlestick . This leads to profit taking, as buyers begin to sell their profitable long positions, which is heightened
by responsive sellers entering the market due to perceived overvaluation. This "double whammy" of selling
pressure essentially pushes price lower, as responsive sellers take control of the market and push price back
toward fair value.

PivotBoss Extreme Reversal SetupPATTERN SUMMARY
1. The first bar of the pattern is about two times larger than the average size of the candles in the lookback
period.
2. The body of the first bar of the pattern should encompass more than 50 percent of the bar's total range, but
usually not more than 85 percent.
3. The second bar of the pattern opposes the first. If the first bar of the pattern is bullish (C > 0), then the second
bar must be bearish (C < 0). If the first bar is bearish (C < 0), then the second bar must be bullish (C > 0).
PATTERN PSYCHOLOGY
The extreme reversal setup is a clever pattern that capitalizes on the ongoing psychological patterns of
investors, traders, and institutions. Basically, the setup looks for an extreme pattern of selling pressure and then
looks to fade this behavior to capture a bullish move higher (reverse for shorts). In essence, this setup is visually
pointing out oversold and overbought scenarios that forces responsive buyers and sellers to come out of the dark
and put their money to work-price has been over-extended and must be pushed back toward a fair area of value
so two-sided trade can take place.
This setup works because many normal investors, or casual traders, head for the exits once their trade
begins to move sharply against them. When this happens, price becomes extremely overbought or oversold,
creating value for responsive buyers and sellers. Therefore, savvy professionals will see that price is above or
below value and will seize the opportunity. When the scared money is selling, the smart money begins to buy, and
Vice versa.
Look at it this way, when the market sells off sharply in one giant candlestick, traders that were short
during the drop begin to cover their profitable positions by buying. Likewise, the traders that were on the
sidelines during the sell-off now see value in lower prices and begin to buy, thus doubling up on the buying
pressure. This helps to spark a sharp v-bottom reversal that pushes price in the opposite direction back toward
fair value.

MRG VWAP CompleteMRG VWAP Complete - Indicator Description
📊 Overview
MRG VWAP Complete is a professional all-in-one VWAP indicator that combines two powerful volume-weighted average price tools into a single, highly customizable solution. This indicator provides traders with both anchored VWAP with deviation bands and a weekly VWAP that resets every Sunday, offering comprehensive price analysis across multiple timeframes.
🎯 Key Features
Dual VWAP System
Standard VWAP: Highly configurable with multiple anchor periods and deviation bands
Weekly VWAP: Automatically resets every Sunday for swing trading strategies
Option to display both simultaneously or independently
Standard VWAP Capabilities
Multiple Anchor Periods:
Session (Daily)
Week / Month / Quarter / Year
Decade / Century
Corporate Events: Earnings / Dividends / Splits
Customizable Parameters:
Source selection (HLC3, Close, Open, etc.)
Hide on 1D timeframes and above
Offset adjustment
Custom color and line thickness (1-5)
Advanced Deviation Bands System
Three Independent Band Levels:
Each band can be enabled/disabled individually
Customizable multipliers for each level
Independent color selection for each band
Optional fill toggle for each band
Two Calculation Modes:
Standard Deviation: Traditional statistical approach
Percentage: Distance calculated as percentage of VWAP value
Visual Customization:
✅ Enable/disable band fills independently
🎨 Choose any color for each band
📏 Transparent fills (95% opacity) for clear price action visibility
🎯 Clean chart display with only desired elements
Weekly VWAP Features
Resets automatically every Sunday
Customizable source input
Independent color and line width settings
Perfect for identifying weekly trends and key levels
⚙️ Complete Parameter List
Display Options
Show/Hide Standard VWAP
Show/Hide Weekly VWAP
Standard VWAP Settings
Anchor Period selection
Source selection
Hide on 1D or above option
Offset value
VWAP color
VWAP line width (1-5)
Bands Settings
Calculation mode (Standard Deviation / Percentage)
Band #1: Enable, Multiplier, Color, Fill toggle
Band #2: Enable, Multiplier, Color, Fill toggle
Band #3: Enable, Multiplier, Color, Fill toggle
Weekly VWAP Settings
Weekly VWAP color
Weekly VWAP line width (1-5)
Source selection
📈 Strategic Applications
Mean Reversion Trading
Use deviation bands to identify overbought/oversold conditions
Enter trades when price reaches outer bands
Target VWAP for exits
Trend Confirmation
Price above VWAP = Bullish bias
Price below VWAP = Bearish bias
Weekly VWAP confirms longer-term trend direction
Support & Resistance
VWAP acts as dynamic support/resistance
Deviation bands provide multiple levels for entries/exits
Weekly VWAP identifies major swing levels
Multi-Timeframe Analysis
Combine Standard VWAP (intraday) with Weekly VWAP (swing)
Identify confluence zones where both VWAPs align
Spot divergences between short-term and weekly trends
Breakout Trading
Monitor price action around VWAP levels
Trade breakouts through deviation bands
Weekly VWAP breaks signal strong momentum
💡 Advantages
✨ All-in-One Solution: No need for multiple VWAP indicators
⏱️ Time-Saving: Pre-configured with professional settings
🎯 Precision: Multiple anchor periods for different trading styles
🎨 Fully Customizable: Every visual element can be adjusted
📊 Clean Charts: Toggle fills on/off for optimal visualization
🔄 Automatic Updates: Both VWAPs update in real-time
📱 Universal: Works on all timeframes and instruments
🎓 Ideal For
Trading Styles
Day Trading (M1, M5, M15)
Swing Trading (H1, H4, D1)
Scalping strategies
Position trading
Markets
Forex (XAUUSD, EUR/USD, GBP/USD, etc.)
Indices (US30, NAS100, SPX500)
Cryptocurrencies
Commodities
Stocks
Strategies
VWAP mean reversion
Trend following
Breakout trading
Volume-weighted support/resistance
Institutional order flow analysis
🔧 Recommended Settings
For Day Trading (M5-M15)
Standard VWAP: Anchor = Session
Band #1: Multiplier 1.0, Fill ON
Band #2: Multiplier 2.0, Fill OFF
Weekly VWAP: Enabled for major levels
For Swing Trading (H1-H4)
Standard VWAP: Anchor = Week
Band #1: Multiplier 1.5, Fill ON
Band #2: Multiplier 2.5, Fill ON
Weekly VWAP: Primary level for trend confirmation
For Scalping (M1-M5)
Standard VWAP: Anchor = Session
Band #1: Multiplier 0.5, Fill ON
Band #2: Multiplier 1.0, Fill OFF
Weekly VWAP: Disabled for cleaner chart
📊 Understanding the Bands
Band Multiplier = 1.0
Contains ~68% of price action (1 standard deviation)
Primary mean reversion zone
Band Multiplier = 2.0
Contains ~95% of price action (2 standard deviations)
Strong overbought/oversold signal
Band Multiplier = 3.0
Contains ~99.7% of price action (3 standard deviations)
Extreme reversal zones
🎯 Trading Tips
Confluence Trading: Enter when price touches a deviation band AND Weekly VWAP
Trend Confirmation: Only take long trades above both VWAPs, shorts below both
Band Rejection: Watch for candle rejections at outer bands for reversal signals
Volume Confirmation: Strong moves should break bands with high volume
Time of Day: VWAP is most reliable during high-volume sessions
📌 Important Notes
VWAP resets based on anchor period selection
Weekly VWAP uses Sunday as the start of the week
Deviation bands require sufficient volume data
Best used in combination with other technical analysis tools
Not a standalone trading system - use proper risk management
🚀 Why Choose MRG VWAP Complete?
✅ Professional Grade: Used by institutional traders
✅ Maximum Flexibility: Adapt to any trading style
✅ Visual Clarity: Customizable colors and fills
✅ Dual Perspective: Intraday + weekly analysis combined
✅ Easy to Use: Intuitive parameter organization
✅ Performance Optimized: Efficient code for smooth charting
Master volume-weighted price analysis with the most complete VWAP indicator available! 📊🚀
💼 Perfect For Professional Traders
Whether you're a retail trader or institutional analyst, MRG VWAP Complete provides the tools you need to:
Identify fair value zones
Spot institutional order flow
Time entries with precision
Manage risk effectively
Trade with the smart money
Elevate your VWAP trading to the next level! 💎

Level to level Multi-TF + ATRLevel to level Multi-Timeframe + ATR/ADR Daily Progress
This indicator is a complete multi-timeframe market structure and volatility toolkit, designed primarily for active forex traders.
It combines Williams Fractals on five higher timeframes (Weekly, Daily, H4, H1, M5) with a live ATR/ADR dashboard, allowing you to see at a glance how much of the typical daily move has already been completed and how much “room” the market realistically has left to run.
Fractals are drawn as arrows and colored zones that clearly mark swing highs and lows, supply/demand pockets, and key reaction areas. These zones can be used as dynamic support/resistance, liquidity pools, and target/stop regions. The multi‑TF design lets you read higher‑timeframe structure while executing on lower timeframes, which is ideal for scalping and intraday trading.
The built‑in volatility table shows:
ATR Progress (%) with green / yellow / red status to indicate whether the current session is still developing, mature, or potentially exhausted.
Daily ATR & ADR values in pips, so you always know the typical and current range of the day.
Done / Left range, highlighting how many pips have already been travelled from low to high, and how many are statistically left.
ATR and ADR projection lines are also plotted from the daily open, giving you clear intraday reference levels for take profit, stop placement, and expected session extremes.
This tool works especially well when combined with Smart Money Concepts (SMC) such as:
Break of Structure (BOS) and Change of Character (CHoCH) using fractal highs/lows.
Liquidity grabs and stop hunts around fractal zones.
Order blocks and fair value gaps that overlap with higher‑TF fractals and ATR/ADR levels.
Use it on majors like EUR/USD, GBP/USD, XAU/USD or indices, on anything from fast M1–M5 scalping to H1–H4 swing trading. All colors, timeframes, sensitivities and volatility settings are fully customizable so you can adapt it to your own style and template.

SMC Liquidity EngineSMC Liquidity Engine MTF is a multi-timeframe market structure and liquidity-based trading system designed to track institutional order flow. It identifies swing highs and lows to map market structure, detects breaks of structure and changes of character, and filters entries using higher-timeframe bias. By combining liquidity sweeps with structure shifts, the system highlights high-probability reversal and continuation zones where smart money is most likely active.
In normal human language, it waits for price to hunt stops, confirms the trend on a higher timeframe, then marks where professionals would step in. That is how you avoid getting farmed by noise and actually trade with intent.

P/D Price LevelsCore Objective: This indicator is meticulously designed to help traders pinpoint Value Zones with precision. The primary goal is to identify optimal Discount levels for long positions and potential Premium levels for short positions.
Based on Smart Money Concepts (SMC), trading at overbought or oversold extremes relative to a specific reference point (Swing High/Low) significantly enhances your Risk-to-Reward (R:R) ratio.
Key Features:
Dynamic Source Selection: Automatically detects the highest peak or lowest trough within a user-defined lookback period, or allows for manual price input for higher timeframe analysis.
10 Fully Customizable Levels: Flexibility to set up to 10 unique percentage (%) offsets. This is crucial as different assets (Gold, Forex, Stocks, or Crypto) exhibit varying volatility profiles and "Golden" discount levels.
Minimalist Interface: All lines and labels are rendered in a subtle light gray and anchored to the right margin. This ensures a clean workspace that doesn't clutter your price action analysis.
Precision Engineering: Optimized for Pine Script v6 to ensure lines remain perfectly horizontal, eliminating common display glitches.
How to Use:
Auto Mode: The script identifies the highest/lowest price within your chosen "Lookback" period as the base.
Manual Mode: If you have identified a significant HTF (Higher Timeframe) Swing High/Low, simply input the price manually in the settings.
The Strategy: Monitor price reaction at key percentages (e.g., 5%, 7%, or 10% discount from a high) to find high-probability reversal or trend continuation signals.
"Trading involves risk. This script is for educational purposes and should not be considered financial advice."
